
An investment or sale in real estate is no random guesswork. In order to properly determine the value of a home, research is required and that takes a lot of time. The Housing Analytics tool can take this work off your hands by visualizing the most important data in one place. This gives you quarterly insight at national, provincial and municipal level into the price development, overbids/undercuts and sales time.
Find out the latest trends
Housing Analytics shows the most important figures of the past quarter of a year. This provides a good overview of the state of the housing market and what trends can be seen at the moment. All values are compared with previous quarters, so that it is clear to see whether, for example, the average asking price of a home in your region has become higher or lower.
The dashboard provides direct insight into the current housing market figures for your region. This data comes from various data sources and is cleaned and visualized by us to give you a representative picture of the current state of affairs. Unique market information has never been so easy and fast at your service!
Data at different levels
Housing Analytics can be used on different levels. First, you will see the figures for the whole of the Netherlands. After that, you can filter by the province or municipality in which you are active. You can also filter on a specific housing type, year of construction and/or surface area. Suppose you want to know how many semi-detached houses have been sold in the municipality of Alkmaar. You can then indicate that you only want to see this data and the graphs will adjust immediately.
Graph by housing type in Alkmaar
Graph filtered on semi-detached houses in Alkmaar
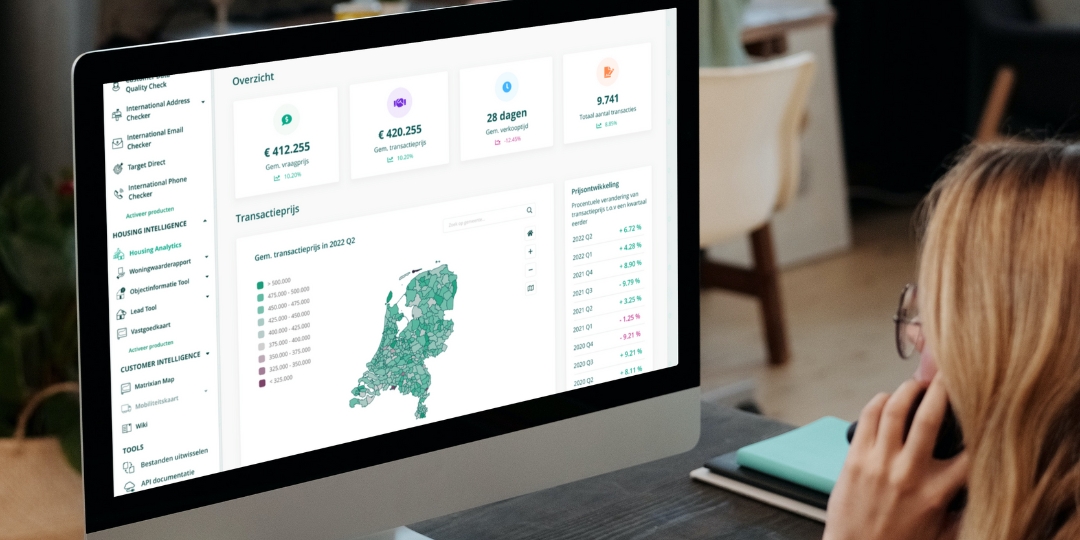
Transaction prices
The tool mainly focuses on three components: the transaction prices, the overbids/undercuts and the selling time. With the transaction prices you get a good picture of the current state of the market and you can take this with you to, for example, a sales meeting with potential customers. You can also use this information to interpret and respond to the latest developments in the market.
Map transaction prices by municipality
Overbids/undercuts
You can use the overbids/undercuts to make new investments. For example, the tool shows that the number of overbids has increased considerably in recent years, but that the tipping point may have been reached. Whether this trend will continue remains to be seen. With Housing Analytics, you can keep a close eye on this.
Graph transaction price versus asking price (overbids and/or undercuts) in Alkmaar
Sales time
The number of days an object is for sale tells a lot about the state of affairs in the housing market. A tight supply often leads to objects being sold within a short period of time, which you can take into account when investing or selling a home. On our dashboard you only see the homes that have actually been sold, so that you get a representative view of the market. This can help you in the final decision of whether or not to make a deal.

Chart average sales time in days in Alkmaar
Do you want to know more about Housing Analytics?
In the video below we give you a little preview of our platform.
Keep on developing
Housing Analytics will be provided with even more applications in the coming months. One of our objectives is to show the figures not only at national, provincial and municipal level, but also at district and neighborhood level. In addition, the figures will also be available per month, so that even more specific comparisons can be made.
Do you have a wish or suggestion to make our tool even more valuable? Let us know! We are always open to feedback.
Related products

Automated Valuation Model (AVM)
